Senior Scientist Carly Nemanic guides clients through a systemswide understanding of their environmental, social, and governance risks. She takes a big-picture view of addressing those risks, looking at everything from water use to carbon emissions to business processes in order to meet environmental sustainability goals.
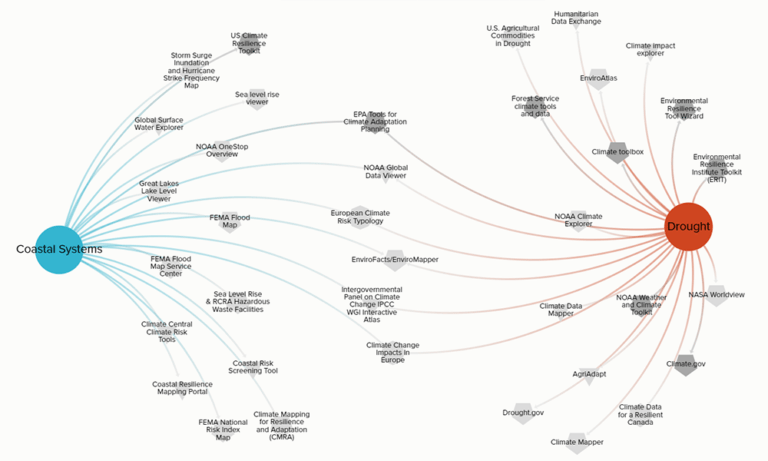
Recently, along with Haley & Aldrich’s Hannah Sawyer and Sam Fisher, Carly created a tool to simplify the assessment of resilience and environmental risks related to climate change. As part of the nonprofit ASTM International’s New Guide for Climate and Community Mapping subcommittee, they’d been tracking the many tools available for mapping and assessing hazards such as flooding and air pollution. Using the data visualization software Kumu, Carly designed a database and visual interface for locating the right tool for the job among these many options.
Describe the problem you’ve helped ASTM address with this database and dashboard.
ASTM develops safety and measurement standards for all sorts of things. Usually, they’re dealing with a topic where there’s a known way of doing something, and they’re essentially codifying that standard. But how we measure climate change — how it could impact people, ecosystems, and physical infrastructure — is very dynamic. All kinds of mapping and assessment tools have been and are being developed at the federal, state, and local levels to try to help people understand what could happen in their areas — things like flooding, increased precipitation, wildfires.
With all these tools, there’s a lack of uniformity in what they measure and where they get their data. Some are more comprehensive than others. So as ASTM develops standards related to climate and environmental risks, we’ve been trying to provide a way to navigate these tools — how to understand the pros and cons of each and how they interrelate. We’ve wanted to make them searchable in different ways — like what variables you need to look at for the specific project you’re working on, whether it’s a specific environmental hazard or a more general need, such as grant writing.
How could your solution help ASTM’s audience and others, including Haley & Aldrich’s clients, plan for climate change?
The idea is that once the ASTM standard becomes finalized, anyone — community groups, private-sector companies, governments — could use our dashboard or something like it to assess the impact of the climate on vulnerable communities or projects and strengthen their resilience.
We had been tracking mapping and assessment tools with a complicated spreadsheet that was terrible to search and update. I’d heard of Kumu before, and I thought maybe this was a perfect opportunity to leverage technology and good graphic design to tackle a tough problem. Essentially, I put all the tools into Kumu and made them searchable by different variables. I have a design background, so I drew on that to create an interface that would be easy to navigate visually.

Climate and Community Mapping tool showing a focused view of the selected risks—coastal systems and drought.
In many ways, I think this project exemplifies what Haley & Aldrich does well — merging the technical and human aspects of a problem to meet a goal. Environmental mapping and assessment tools are all about the technical aspects of resilience, such as how many feet of sea-level rise to expect along a certain stretch of coastline. Then there are the human aspects of resilience — how to drive change and see systems as a whole in order to make our communities more resilient. This tool brings those aspects together. It’s designed as a way for humans to find what they need among a sea of technical information, to more efficiently get a whole-systems view of resilience.
I grew up in the woods and have always felt connected to the environment. After starting my career at Haley & Aldrich in field services, I was up every morning, sometimes at 4 or 5 a.m., directing people to clean up all kinds of nasty materials that only about 100 years ago got buried or leached into the ground. I started thinking about the next 100 years — what we were going to need to fix in that time frame — and decided I wanted to dedicate my efforts to preventing that.
I’m also very visually inclined and studied graphic design before I got into science. I’m very attached to organization and logic, and that’s driven me to create dashboards and get to know software that’ll help make work more efficient and more visually appealing.
Published: 6/21/2024


